Population
Today, you are one of 7 billion people on Earth. Global population is expected to reach 8 billion by 2025, according to the United Nations.
This historic milestone is rekindling age-old debates over birth control, protecting natural resources and reducing consumption. It also has many wondering whether the Earth can support so many people.
This historic milestone is rekindling age-old debates over birth control, protecting natural resources and reducing consumption. It also has many wondering whether the Earth can support so many people.
Natural Increase Rate

When studying population, it is important to look at a country using crude birth rate and crude death rate to determine the changes that will occur within a population in the future.
Crude birth rate = number of births per 1,000 people per year
Crude death rate = number of deaths per 1,000 people per year
Natural increase rate = Live births vs. live deaths (NIR = Births - Deaths)
Crude birth rate = number of births per 1,000 people per year
Crude death rate = number of deaths per 1,000 people per year
Natural increase rate = Live births vs. live deaths (NIR = Births - Deaths)
Population Pyramids
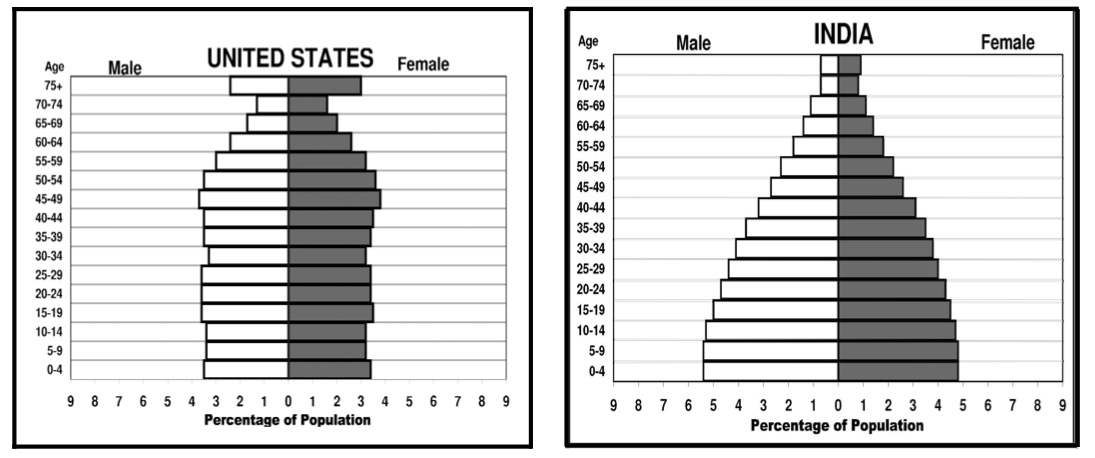
Population pyramids help make population projections for different countries. These graphs depict the make-up of a country's population as impacted by 70 to 80 years of economic, political, and natural events. The shape of each pyramid provides clues into life in each country.
|
A graph shaped like a column represents a developed country. Developed countries have low infant mortality rates and slow population growth. Life expectancy is also long. The United States seen above is an example of a column shaped population pyramid.
|
A graph shaped like a pyramid represents a developing country. Developing countries have high birth rates and as a result, growth rates are fast. In developing countries, life expectancy is low. India seen above is an example of a pyramid shaped population pyramid.
|
Population pyramids can also be shaped like a cone. Cones represent developed countries with negative population growth. In these countries, there is a low birth rate and long life expectancy resulting in a shrinking population.
Population Policies
The study of population trends has led countries to put population policies into place. Population Policies are strategies designed to achieve a particular pattern of population change.
There are two common types of population policies put into place.
Expansive Population Policies are when the government encourages large families and raises the rate of population growth.
Restrictive Population Policies are when the government puts a policy into place designed to reduce the rate of natural increase (population growth).
Population Density vs. Dispersion
Geographers also study where people live. Are they close together or far apart? People are not distributed evenly around the world!
Population distribution is the way a population is dispersed (spread) throughout an area. Population distribution is determined by climate, natural resources, work opportunities, and social services.
Population distribution is the way a population is dispersed (spread) throughout an area. Population distribution is determined by climate, natural resources, work opportunities, and social services.

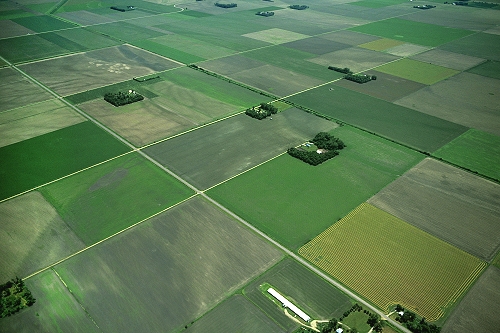
Population density refers to how many people there are in a certain area. Cities are more dense than rural areas where people are more spread out.
|

|
